
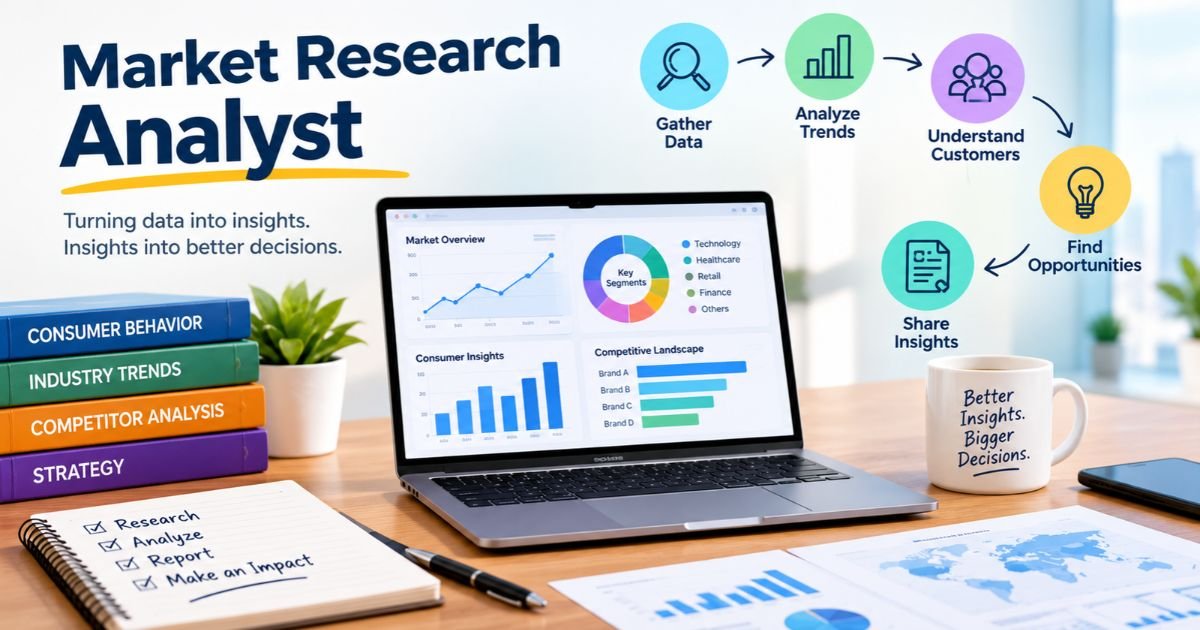
Every product launch, price change, and ad campaign rests on a guess about customers. A Market Research Analyst replaces that guess with evidence. They collect data on buyers, competitors, and market conditions, then turn it into a recommendation a team can act on.
That sounds tidy. In practice it means half-completed surveys, data sources that disagree with each other, and stakeholders who’d like the answer to be “yes” before the analysis even starts. The role pays well for handling that mess properly. The US Bureau of Labor Statistics (BLS) reported a median annual wage of $76,950 for the occupation in May 2024 and projects 7% employment growth between 2024 and 2034, which it describes as much faster than average.
This guide covers what the job involves, the skills employers screen for, every major tool you’ll be expected to know, what the role pays in the US and India, how careers progress, and how it differs from neighbouring jobs. It’s written for people deciding whether to enter the field, and for marketers who want to work better with the analysts on their team.
What Does a Research Analyst Do Day to Day?
A research analyst gathers and interprets data about customers, competitors, and markets so a company can decide what to sell, to whom, and at what price. The work splits into three parts: collecting information, analysing it, and presenting findings that change a decision.
Core responsibilities
The BLS describes the job as gathering and analysing data on consumers and competitors, using statistical techniques and software, and measuring how well marketing strategies work. In day-to-day terms, that breaks down into a handful of recurring tasks:
- Designing surveys, interview guides, and focus group discussion guides
- Pulling secondary data from industry reports, government statistics, and web analytics
- Tracking competitors’ pricing, positioning, and product launches
- Cleaning datasets and running statistical tests to separate real patterns from noise
- Forecasting demand for a product, region, or customer segment
- Turning findings into short, decision-ready presentations
Notice the last item. Most analysts will tell you the analysis is the easy half. Getting a sceptical product manager to change a roadmap because of a chart is the hard half.
What a typical week looks like
Picture a research team at a quick commerce company such as Zepto, which built its business around delivery in minutes. Before adding a new product category to its dark stores, the team would want to know who actually buys it, how often, and what they pay elsewhere. (This is an illustration of the type of question, not a record of a real Zepto study.)
Monday starts with the brief: what decision is this research supposed to inform? Tuesday and Wednesday go to fieldwork, which might mean a short customer survey plus a pull of competitor prices. Thursday is analysis. Friday is the readout, where the analyst presents two or three findings and a recommendation, not forty slides.
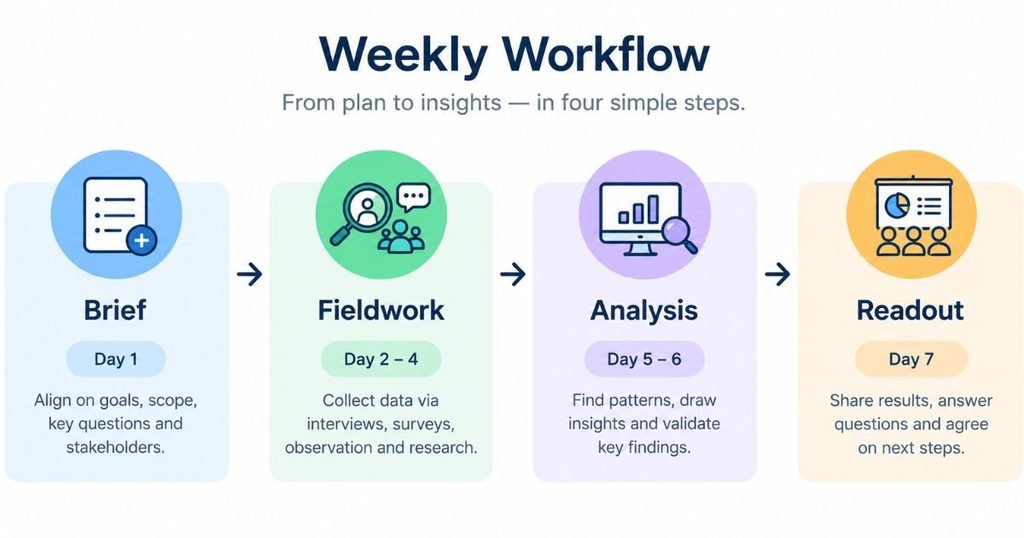
A research analyst collects and interprets data on consumers, competitors, and market conditions to help a company make better decisions about products, pricing, and marketing. According to the BLS, the work involves statistical analysis, software, and presenting results to clients or internal teams. The deliverable is a recommendation, not a pile of data.
Which Skills Do You Need to Get Hired?
Employers hire research analysts for a mix of statistical judgment, technical fluency, and communication. Technical skills get you the interview. Communication skills decide how far you go.
Hard skills
Start with statistics. You should be comfortable with descriptive measures, confidence intervals, significance testing, and basic regression. You don’t need a PhD, but you do need to know why a 4% difference in a sample of 80 people probably means nothing.
Survey design comes next. Poorly worded questions produce garbage data no matter how good the analysis is. Leading questions, double-barrelled questions, and unrepresentative samples are the three mistakes that sink most junior projects.
Then there’s data handling. A Market Research Analyst who can write SQL queries and clean data in Excel or Python stops waiting on the data team and starts finishing projects faster. Add qualitative methods (running interviews, coding open-ended responses into themes) and data visualisation, and you’ve covered the core technical checklist.
Soft skills
Storytelling is the big one. A finding that nobody remembers didn’t change anything, so you need to frame results around the decision the audience has to make.
Scepticism matters just as much. Good analysts question their own data first: Who didn’t answer? What did we not ask? Is this a trend or one loud month?
Finally, the BLS notes that analysts need close attention to detail, because small errors in sampling or weighting can quietly flip a conclusion. Curiosity ties it together. The people who do well in this field genuinely want to know why customers behave the way they do.
What education do you need?
The BLS says the occupation typically requires a bachelor’s degree. Common majors include marketing, statistics, economics, psychology, sociology, and business. Senior and specialist roles often prefer a master’s degree or an MBA. Certification is voluntary, though the Insights Association offers the Professional Researcher Certification (PRC), which some employers value.
Which Tools Does an Analyst Use, and What Does Each One Do?
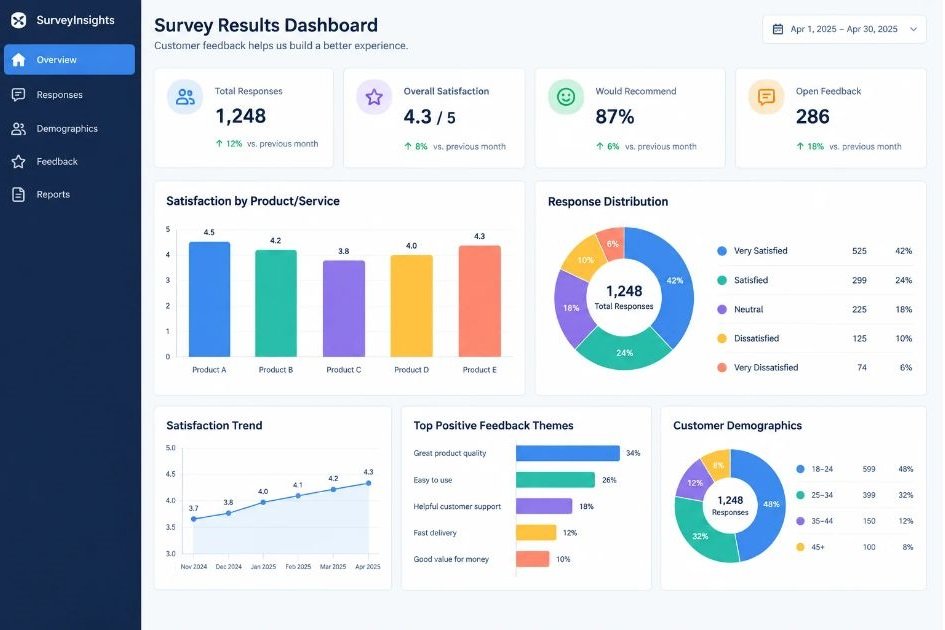
Research tools fall into four groups: survey and data collection, analysis and statistics, visualisation and reporting, and market and consumer intelligence. You don’t need all of them on day one. You do need to understand what each one is for, so here’s every major tool explained.
Survey and data collection tools
Google Forms is the free starting point. It builds basic surveys with multiple choice, scales, and open text, and sends responses straight into Google Sheets. Branching is limited to section-based logic, and there’s no quota control, so it suits quick internal polls or pilot tests rather than large studies.
SurveyMonkey sits a step up. It offers question templates, skip logic, and built-in reporting, plus a paid panel service (SurveyMonkey Audience) for recruiting respondents outside your own list. It’s a common choice for small and mid-sized teams that need fast turnaround and don’t want to learn a heavyweight platform.
Typeform shows one question at a time in a conversational layout, which tends to feel friendlier to respondents, especially on mobile. Logic jumps let you customise paths. The trade-off: its built-in analysis is lighter than dedicated research platforms, so most teams export the data for deeper work.
Qualtrics is the enterprise option. It handles complex survey logic, randomisation, quotas, and advanced study designs such as conjoint and MaxDiff on higher tiers. Large brands and universities use it because it combines panel access, analysis, and governance in one place. It’s powerful, but it carries a steeper learning curve and a price tag to match.
Analysis and statistics tools
Microsoft Excel remains the most-used analysis tool in the profession. Pivot tables summarise thousands of rows in seconds, Power Query cleans messy imports, and functions like XLOOKUP join datasets. Its weakness is size and reproducibility: very large files get slow, and it’s hard to audit a workbook full of manual edits.
Google Sheets covers similar ground in the browser, with real-time collaboration. Functions like QUERY and IMPORTRANGE let you pull and filter data across files. Teams that share a living tracker (competitor prices, weekly survey counts) often prefer it over emailing spreadsheets around.
IBM SPSS Statistics is a menu-driven statistics package long popular in survey research. You can run crosstabs, t-tests, ANOVA, factor analysis, and regression without writing code. Many agencies and academic-trained researchers still use it, though licences are expensive compared with open-source alternatives.
R is a free, open-source language built for statistics. The tidyverse packages handle data cleaning, ggplot2 produces publication-quality charts, and the survey package handles weighted samples properly. It has a learning curve, but analyses are scripted, which makes them repeatable and easy to check.
Python does the same job and more. Libraries like pandas (data manipulation), SciPy and statsmodels (statistical tests), and scikit-learn (clustering and segmentation) cover most research needs, while NLTK and spaCy help analyse open-ended text. Python is the better pick if you also want to automate reports or scrape public data.
SQL (Structured Query Language) is how you pull data from relational databases. Joins, filters, and GROUP BY queries let you build a customer dataset without asking an engineer. It’s a small language to learn, and for analysts working inside larger companies, it’s often the single most useful skill after Excel.
Visualisation and reporting tools
Tableau turns data into interactive dashboards with drag-and-drop controls. Stakeholders can filter by region or segment themselves instead of requesting a new chart each time. Tableau Public is free, which makes it a good way to build a portfolio, though anything you publish there is visible to everyone.
Microsoft Power BI does similar work and fits naturally into companies already running on Microsoft products. Power Query handles data preparation, and DAX (its formula language) builds calculated measures. Power BI Desktop is free to use for building reports; sharing them across a company needs a paid licence.
Looker Studio is Google’s free dashboard tool. It connects directly to Google Analytics 4, Google Sheets, and Google Ads, so it’s handy for tracking campaign and survey data in one view. Its modelling features are simpler than Tableau or Power BI, which is fine for most routine reporting.
Market and consumer intelligence tools
Google Trends shows how interest in a search term changes over time and by region, scaled from 0 to 100. It’s excellent for spotting seasonality and rising topics. One limit catches beginners out: it shows relative interest, not search volume, so it can’t tell you how many people are searching.
Similarweb estimates website and app traffic, traffic sources, and audience overlap for competitors. You can see whether a rival relies on search, social, or direct visits. Keep in mind these are modelled estimates, so treat them as directional rather than exact.
Statista collects statistics from thousands of public and commercial sources into one searchable library, with ready-made charts. It’s a fast way to size a market or find a benchmark. The catch is that you should always click through to the original source before you cite a number in a client deck.
Semrush is built for search marketing, but research analysts use it for competitive intelligence. It reveals which keywords a competitor ranks for, what they spend on paid search, and how their organic traffic is trending. That makes it useful for judging how crowded a category is.
Brandwatch is a social listening platform. It tracks mentions of a brand, product, or topic across social networks and the wider web, and measures volume and sentiment. Analysts use it to catch customer complaints early and to see how people actually talk about a category, in their own words.
Nielsen and NielsenIQ are two separate companies that came out of one. Nielsen focuses on audience measurement (such as TV and streaming viewership), while NielsenIQ focuses on retail sales and consumer purchase data. Consumer goods brands use this data to see what’s selling in which stores. It’s expensive and typically bought at company level, not by individuals.
| Job to be done | Tools to know | Best for |
|---|---|---|
| Collecting survey data | Google Forms, SurveyMonkey, Typeform, Qualtrics | Quick polls to enterprise studies |
| Analysing data | Excel, Google Sheets, SPSS, R, Python, SQL | Cleaning, testing, modelling |
| Presenting results | Tableau, Power BI, Looker Studio | Dashboards and stakeholder reports |
| Tracking markets and rivals | Google Trends, Similarweb, Statista, Semrush, Brandwatch, Nielsen | Trends, competitor traffic, sentiment, sales data |
Market Research Analyst Salary: What Do You Actually Earn?
In the US, the BLS reports a median annual wage of $76,950 for the occupation as of May 2024. Glassdoor’s median total pay is higher, at $95,000 as of February 2026. In India, Glassdoor’s average sits around ₹5 lakh a year as of August 2026.
Why do the numbers differ? Methodology. The BLS surveys employers about wages, while Glassdoor aggregates self-reported total pay, which includes bonuses and tends to skew toward larger employers in big metros. Any Market Research Analyst Salary figure you read online is only as good as its source and its date, so check both.
US salary
For the US, treat roughly $77,000 as the middle of the market, with the realistic range stretching well above that for experienced analysts in high-paying cities. A 2026 Coursera salary roundup lists Washington, California, and New York among the top-paying states. Entry-level pay sits below the median and climbs as you add years and technical skills.
India salary
India’s numbers are lower in absolute terms and wider in spread. Glassdoor’s data, based on 1,402 salary submissions as of August 2026, puts the average at ₹500,000 a year, with the typical range running from ₹339,750 (25th percentile) to ₹715,500 (75th percentile). Payscale’s 2026 data shows a similar average base salary of ₹499,483, rising to an average of ₹866,827 for experienced analysts.
| Source | Market | Figure | Date |
|---|---|---|---|
| US Bureau of Labor Statistics | US | $76,950 median annual wage | May 2024 |
| Glassdoor | US | $95,000 median total pay | February 2026 |
| Glassdoor | India | ₹500,000 average; ₹339,750 to ₹715,500 typical range | August 2026 |
| Payscale | India | ₹499,483 average base; ₹866,827 for experienced analysts | 2026 |
One caution: these are self-reported and survey-based figures, and they vary by city, employer size, and seniority. Use them as a negotiation reference, not a promise.
What pushes pay higher?
Technical skills move the needle fastest. An analyst who can run statistical models in R or Python, or build dashboards in Tableau or Power BI, usually earns more than one who only reports survey percentages. Industry matters too: technology, finance, and consumer goods firms with large research budgets tend to pay above agencies and non-profits.
Other levers are a master’s degree or MBA, specialising in a hard-to-staff niche (pricing research, healthcare, B2B), and moving into people management. And yes, switching employers every few years often raises pay faster than waiting for annual increments.
The BLS reported a median annual wage of $76,950 for the occupation in May 2024, while Glassdoor’s US median total pay stood at $95,000 in February 2026. In India, Glassdoor’s average was about ₹5 lakh a year in August 2026, with Payscale reporting a similar average base salary. Differences between sources reflect methodology, bonuses, and city mix.
What Does the Market Research Analyst Career Path Look Like?
Most people start as a junior analyst, progress to senior analyst within a few years, and then choose between managing people or becoming a specialist. The Market Research Analyst Career Path is less rigid than law or medicine, so titles and timelines vary by company.
| Stage | Typical experience | Main focus |
|---|---|---|
| Research assistant / junior analyst | 0 to 2 years | Data collection, cleaning, basic reporting |
| Research analyst | 2 to 4 years | Owning small projects, running analysis |
| Senior analyst | 4 to 7 years | Leading studies, advising stakeholders |
| Research manager | 7 to 10 years | Managing a team, setting methodology |
| Director / head of insights | 10+ years | Research strategy, budget, executive reporting |
The experience bands above are rough industry norms, not official figures. A strong analyst at a fast-growing startup can move quicker than that, and a large corporation might move slower.
Specialisations worth considering
Around the mid-career point, many analysts pick a lane. Consumer insights focuses on shopper behaviour and brand health. B2B research studies business buyers, who are fewer, harder to reach, and more valuable per interview. Others move into pricing research, UX research, competitive intelligence, or healthcare and pharma research, which often demand domain knowledge and pay accordingly.
Where else can the career lead?
Wherever the Market Research Analyst Career Path takes you, the skill set transfers well. Analysts regularly move into product marketing, product management, brand management, strategy, and growth roles, because they already know how to find out what customers want. If you’re weighing the move into product work, that route is well worth studying.
Market Research Analyst vs. Data Analyst: What’s the Real Difference?
A research analyst studies people and markets to answer “what do customers want and why?”, while a data analyst studies a company’s internal data to answer “what is happening in our numbers?”. The Market Research Analyst vs. Data Analyst question comes down to where the data comes from and what question it answers.
Research analysts often create their own data through surveys and interviews, then combine it with external sources. Data analysts mostly work with data that already exists, such as product usage logs, sales records, and web analytics, and they tend to write more code.
| Factor | Research analyst | Data analyst |
|---|---|---|
| Main question | Why do customers behave this way? | What do our numbers show? |
| Data source | Surveys, interviews, external reports | Databases, product logs, analytics |
| Typical tools | Qualtrics, SPSS, Excel, Tableau | SQL, Python, Power BI, Tableau |
| Method mix | Qualitative and quantitative | Mostly quantitative |
| Output | Insight and recommendations | Dashboards, models, reports |
There’s plenty of overlap. A research analyst who adds SQL and Python can compete for data roles, and a data analyst who learns survey design can move into research. Which side you choose depends on whether you prefer talking to people or querying databases. When comparing the two paths, the Market Research Analyst vs. Data Analyst gap is narrowing for analysts who pick up both toolkits.
Market Research Analyst vs. Business Analyst: Which Role Fits You?
A business analyst focuses on a company’s internal processes, systems, and requirements, while a research analyst focuses on the external market of customers and competitors. In short, one improves how the business runs and the other explains the world it sells into. That’s the core of the Market Research Analyst vs. Business Analyst split: inward focus versus outward focus.
A business analyst might map out a checkout process, gather requirements for a new CRM system, and work with engineers to define what gets built. Typical tools include Jira, process-mapping software, and SQL. A research analyst, by contrast, might survey customers on why they abandon checkout in the first place.
| Factor | Research analyst | Business analyst |
|---|---|---|
| Focus | External: customers, competitors, markets | Internal: processes, systems, requirements |
| Typical stakeholders | Marketing, product, leadership | IT, operations, finance, product |
| Core deliverable | Insight reports, forecasts | Requirements documents, process maps |
| Common tools | Survey tools, SPSS, Tableau | Jira, SQL, process-modelling tools |
| Best fit if you enjoy | Understanding customer behaviour | Fixing how a business operates |
If you’re torn on Market Research Analyst vs. Business Analyst, ask where you’d rather spend your week. Talking to customers and decoding their behaviour points to research. Untangling workflows and defining systems points to business analysis. Both pay comparably in many markets, and people move between them.
Is Market Research Analyst a Good Career in 2026?
For most people who enjoy data and human behaviour, yes. Demand is growing, pay is above the average for many entry-level business roles, and the skills transfer to product, marketing, and strategy. It’s not for everyone, though, and the honest answer includes the downsides.
When people ask “Is Market Research Analyst a Good Career?”, they usually want to know about job security, income, and growth. On job security, the BLS projects 7% growth from 2024 to 2034 and counted about 941,700 jobs in 2024. On income, a Market Research Analyst Salary in the US sits well above the typical entry wage for many business jobs, and Indian pay is rising with experience and technical skill.
The upsides
You see how decisions actually get made. You build a skill set (statistics, SQL, storytelling) that employers across industries want. And your work is visible, because a good finding can change a product or campaign within weeks.
The downsides
Some projects are repetitive, especially data cleaning and weekly tracking reports. Stakeholders sometimes ignore findings that contradict their plans. Budget cuts hit research teams early, because the value of insight is harder to measure than the value of ad spend. And entry-level roles can be competitive.
What about AI?
AI tools now help code open-ended survey responses, summarise interview transcripts, and draft first-pass reports, which speeds up the repetitive parts. They don’t replace the judgment calls: choosing the right question, spotting a biased sample, and telling a nervous executive something unwelcome. Analysts who treat AI as a faster assistant, and who check its output, are better placed than those who ignore it.
How Do You Break In With No Experience?
You can enter the field without prior experience by building proof of skill through small, public projects, then applying to junior roles and internships. A degree helps, but a portfolio of real analysis often speaks louder.
- Learn the basics of statistics. Cover averages, distributions, sampling, confidence intervals, and significance tests through a free course or textbook.
- Get comfortable in Excel and SQL. Practise pivot tables and write queries against free public datasets.
- Pick one statistical tool. Learn either R or Python well enough to clean a dataset and run a regression.
- Run a real survey. Use Google Forms or Typeform, recruit 50 to 100 respondents, and write up the findings with a clear recommendation.
- Build a visual portfolio. Publish two or three dashboards in Tableau Public or Looker Studio, each answering a real business question.
- Study one industry. Choose a sector such as beauty, fintech, or food delivery and follow its competitors the way an analyst would. Brands like Nykaa and Mamaearth publish enough public material to practise on.
- Apply for junior and internship roles. Target research agencies, consumer brands, and in-house insights teams, and attach your portfolio to every application.
Most beginners skip step 4 and wonder why interviews go nowhere. A live survey shows employers you can handle the messy part of research, not just textbook exercises.
Conclusion
The job comes down to one skill: turning messy evidence about customers into a clear recommendation someone will act on. Statistics, tools, and dashboards all serve that goal.
Pay is solid, with US median wages at $76,950 per the BLS and Indian averages around ₹5 lakh per Glassdoor and Payscale, and it climbs quickly once you add SQL, Python, or a specialisation. Demand is growing, and the skills carry over to product, brand, and strategy roles. So, is Market Research Analyst a good career? For curious, numerate people, the evidence says yes. If you do pursue this path, start small: run one real survey this month and write up what you’d recommend.
FAQs
What does a research analyst do?
A research analyst collects and analyses data on customers, competitors, and market conditions to help a company make decisions about products, pricing, and marketing. They design surveys, run statistical analysis, and present recommendations to stakeholders. The BLS describes the work as gathering and analysing data using statistical techniques and software.
What qualifications do you need to become a research analyst?
The BLS says a bachelor’s degree is typically required, usually in marketing, statistics, economics, psychology, or business. Senior roles often prefer a master’s degree or an MBA. Certification is voluntary, though the Insights Association’s Professional Researcher Certification can strengthen a profile.
How much does a research analyst earn in the US?
The BLS reported a median annual wage of $76,950 in May 2024. Glassdoor’s median total pay was higher at $95,000 as of February 2026, because it includes bonuses and self-reported data. Pay rises with experience, technical skills, and a move into high-paying cities.
How much does a research analyst earn in India?
Glassdoor’s August 2026 data shows an average of about ₹5 lakh a year, with a typical range of ₹339,750 to ₹715,500. Payscale’s 2026 data reports an average base of ₹499,483, and about ₹866,827 for experienced analysts. Your pay depends on city, employer, and skills.
Is a research analyst the same as a data analyst?
No. A research analyst studies customers and markets, often using surveys and external data, while a data analyst mostly works with a company’s internal data and writes more code. The two roles overlap in tools like Excel, Tableau, and SQL, and people move between them.
How is a research analyst different from a business analyst?
A business analyst looks inward, at processes, systems, and requirements. A research analyst looks outward, at customers, competitors, and market trends. If you’d rather decode customer behaviour than redesign workflows, research is the better fit.
Which tools should I learn first?
Start with Excel and Google Forms or SurveyMonkey, because they cover most beginner projects. Then add SQL and one statistics tool, either R or Python. After that, learn a visualisation tool such as Tableau or Power BI to present your results.
Do market researchers need to know coding?
Not always, but it helps a lot. Plenty of junior roles run on Excel and survey platforms. Still, SQL and either R or Python widen your options and your pay, especially in tech companies and larger brands.
Will AI replace research analysts?
AI is taking over repetitive tasks such as coding open-ended responses and drafting summaries, but not the judgment behind good research. Someone still has to define the question, catch bias in the data, and persuade stakeholders to act. Analysts who use AI to speed up routine work while checking its output are in a stronger position.
What do most beginners get wrong about this job?
They focus on tools and ignore the question. A beautiful dashboard that doesn’t answer a business decision is just decoration. The other common mistake is trusting small or biased samples, so always ask who isn’t represented in your data.


