
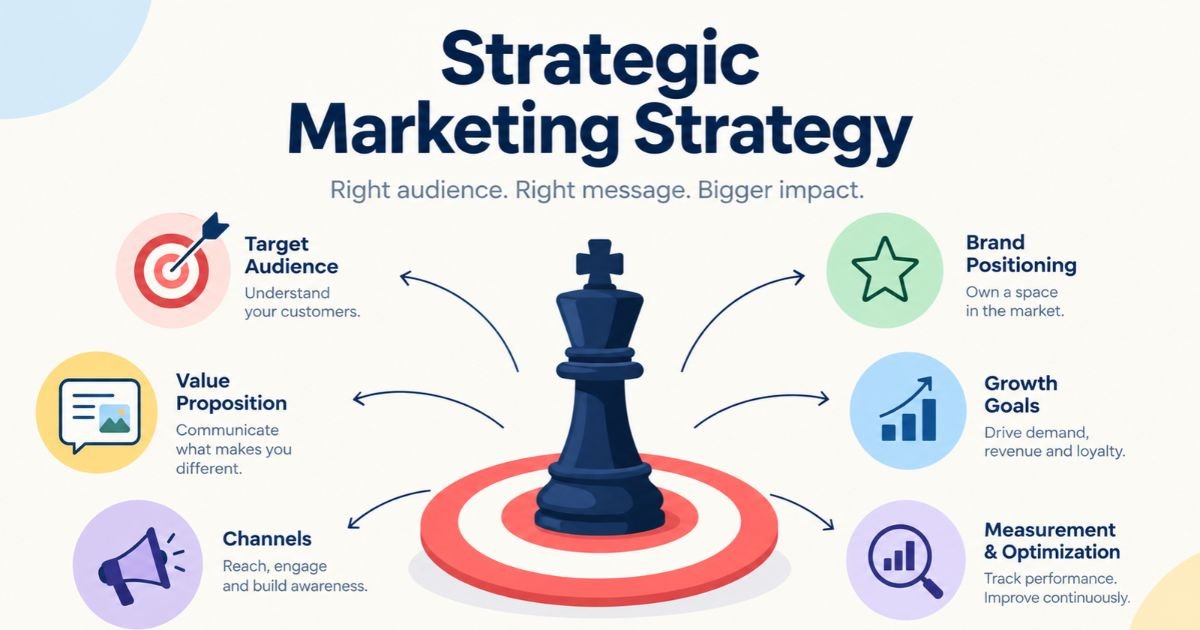
Most marketing teams are busy. Few are pointed in one direction. There’s an Instagram push in one corner, an SEO sprint in another, an email blast before every sale, and when the quarter ends nobody can say how any of it connects to revenue.
A strategic marketing strategy fixes that. It’s the plan that decides who you’re targeting, what you promise them, how you’re different, and where the money goes before anyone opens an ad account. Without one, you’re running activities. With one, those activities start adding up.
The stakes are real. Gartner’s 2026 CMO Spend Survey, which covered 401 marketing leaders between January and March 2026, found marketing budgets at 7.8% of company revenue, barely up from 7.7% in 2025. Budgets aren’t growing to cover bad decisions, so every rupee or dollar has to be placed on purpose. For founders the risk is sharper. CB Insights’ analysis of 101 startup post-mortems found that 42% of failed companies cited no market need, and 14% cited poor marketing.
This article covers the definition, the main types, eleven tools and frameworks explained one by one, a step-by-step planning process, real brand examples, and the mistakes that quietly kill good plans.
What Is Strategic Marketing, and How Is It Different From Tactics?
A strategic marketing strategy is a long-term plan that defines which customers a business will serve, how it will position itself against competitors, and where it will invest marketing resources to hit specific business goals. It answers “where do we play and how do we win,” while tactics answer “what do we do this week.”
People mix the two up constantly. Ask a team for their strategy and you’ll often get a channel list: “Instagram, SEO, and email.” That’s a tactics list. A strategy says who you’re trying to win, why they’d pick you over the alternatives, and what you’ve decided to ignore.
Take Zepto. Choosing to win Indian grocery shoppers on speed, with a 10-minute delivery promise backed by a network of dark stores (small warehouses used only for fulfilling online orders), was a strategic decision. Founders Aadit Palicha and Kaivalya Vohra launched the company in 2021, and every push notification, cashback offer, and referral campaign since has been a tactic serving that one promise.
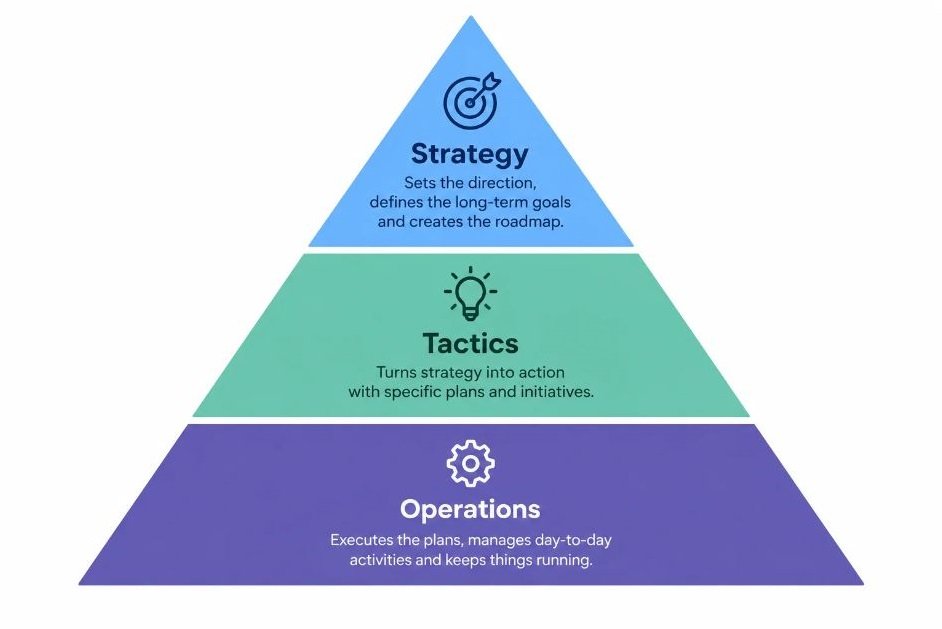
Strategic, Tactical, and Operational Marketing Compared
| Level | Time horizon | Core question | Example from a skincare brand | Usually owned by |
|---|---|---|---|---|
| Strategic | 1 to 3 years | Who do we serve and how do we win? | Own the “toxin-free” position for parents | Founder or CMO |
| Tactical | 1 to 6 months | Which campaigns and channels deliver the strategy? | Six-week creator campaign for a new face wash | Marketing managers |
| Operational | Daily to weekly | How do we get this done? | Brief creators, approve posts, schedule ads | Executors and agencies |
Honestly, most teams spend 90% of their time in the bottom row and wonder why growth feels random. The top row is where decisions get made. The bottom two rows just carry them out.
The Six Components of a Marketing Strategy
Every working strategy contains the same six parts. If one is missing, the plan has a hole you’ll feel later.
- Business goals: the revenue, margin, or market share target marketing must support. A marketing goal with no business goal behind it is a vanity metric.
- Target audience: the specific segment you’ll serve first, described by needs and behaviour, not just age and city.
- Positioning and value proposition: the one reason this audience should choose you over the alternatives.
- Channels and messages: where you’ll reach them and what you’ll say, chosen to fit the audience instead of copying competitors.
- Budget and resources: the money, people, and tools committed, with a share held back for experiments.
- Metrics and review rhythm: the numbers that prove it’s working and the dates when you’ll check.
A marketing strategy is a long-term plan covering goals, audience, positioning, channels, budget, and metrics. It sits above tactics (campaigns) and operations (daily execution), and it decides what a team will do and what it will deliberately skip.
Why Does a Long-Term Marketing Strategy Matter?
Bigger budgets won’t rescue a vague plan, and budgets aren’t getting bigger anyway. Gartner’s 2026 CMO Spend Survey put marketing at 7.8% of company revenue, up from 7.7% the year before. The same survey found CMOs directing an average of 15.3% of marketing budgets to AI initiatives, with 70% calling AI leadership a critical 2026 goal and only 30% reporting that their organizations were ready to scale it.
Put those numbers together. Money is flat, pressure is rising, and new tools are arriving faster than teams can absorb them. A strategy is the filter that decides which tools and channels deserve your attention. AI amplifies whatever direction you give it, including the wrong one.
So what does a written strategy actually buy you?
Focus. You can say no to the tenth channel because the plan already says who you’re serving and where they spend time. That alone saves most small teams months of scattered effort.
Efficient spend. When every campaign traces back to a goal, it’s obvious which ones to cut when budgets tighten. That’s a real advantage when budgets sit flat.
Alignment. Sales, product, and marketing stop pulling in different directions because they’re working from the same audience definition and the same promise.
Learning. A strategy with clear metrics turns every campaign into a test. Without one, results are just noise.
One limit worth stating: a strategy can’t rescue a product nobody wants. CB Insights’ post-mortem analysis ranks “no market need” as the most-cited reason startups fail. Marketing strategy sharpens a good offer. It doesn’t invent demand.
Gartner’s 2026 CMO Spend Survey found marketing budgets flat at 7.8% of company revenue while 15.3% of budgets now go to AI. With money flat and tools multiplying, a written strategy is what decides where limited budget goes.
What Are the Main Types of Strategic Marketing Strategies?
Strategic marketing strategies fall into three broad groups: growth strategies (where to expand), competitive positioning strategies (how to win against rivals), and customer-focused strategies (how to acquire, keep, and build trust with buyers). Most companies run a blend, tilted by stage and market.
Growth Strategies: Where Do You Expand Next?
Growth strategies come from the Ansoff Matrix (explained in detail in the tools section) and split by whether you sell an existing or new product into an existing or new market.
| Strategy | Product | Market | Risk | Real example |
|---|---|---|---|---|
| Market penetration | Existing | Existing | Lowest | Zepto concentrating on dense dark-store coverage in big metros before spreading wider |
| Market development | Existing | New | Medium | Airbnb courting business travellers through its Airbnb for Work program |
| Product development | New | Existing | Medium | Nykaa launching Nykaa Fashion in 2018 for its existing online shoppers |
| Diversification | New | New | Highest | Amazon launching Amazon Web Services in 2006 while still a consumer retailer |
Penetration is the safe default and where most budget should start. Diversification is a bet. Amazon made it work, but for every AWS there are a dozen stalled side projects.
Competitive Positioning Strategies: How Do You Win Against Rivals?
Harvard professor Michael Porter described three generic ways to compete in his 1980 book Competitive Strategy, and they still hold up.
- Cost leadership: win by being the lowest-cost operator and passing savings to buyers. India’s DMart built its brand on “Everyday Low Cost, Everyday Low Prices.”
- Differentiation: win by being meaningfully different in a way buyers value and will pay extra for. Apple’s tightly integrated hardware, software, and services, sold at premium prices, is the textbook case.
- Focus (niche): win by serving one narrow segment better than broad players can. boAt built its brand around young, price-conscious Indian buyers of audio gear and wearables.
Pick one. Companies that try to be cheapest, most premium, and most specialised all at once usually end up stuck in the middle.
Customer-Focused Strategies: Acquisition, Retention, and Brand-Building
Acquisition strategies bring in new customers, usually through paid media, SEO, partnerships, and referrals. Retention strategies raise repeat purchase and lifetime value through email, loyalty programs, and product experience. Brand-building strategies make you the default choice over time through consistent messaging, community, and reputation.
Early-stage brands tilt toward acquisition. Mature brands tilt toward retention and brand. The mistake is picking one and forgetting the others exist.
Which Tools and Frameworks Help You Build a Marketing Strategy?
Strategic marketing frameworks are structured templates that force you to look at a business problem from a fixed angle, so decisions rest on evidence instead of opinion. Tools are the software that supplies the evidence.
Here’s how the eleven covered below fit together.
| Tool | Question it answers | Planning stage |
|---|---|---|
| SWOT analysis | Where do we stand today? | Audit |
| PESTLE analysis | What outside forces will affect us? | Audit |
| Porter’s Five Forces | How attractive and competitive is this market? | Audit |
| STP model | Who do we serve and how do we position? | Choice |
| Ansoff Matrix | Which growth direction should we pick? | Choice |
| BCG Matrix | Which products or brands deserve more investment? | Choice |
| 7Ps marketing mix | How do we turn the strategy into an offer? | Execution |
| Customer journey mapping | Where do customers drop off or get delighted? | Execution |
| OKRs | What outcomes will we chase this quarter? | Management |
| Balanced Scorecard | Is the whole business healthy, not just campaigns? | Management |
| Research and analytics software | What does the data say? | Every stage |
SWOT Analysis: Where Do You Stand Today?
SWOT analysis is a four-box audit that sorts what you know about a business into Strengths, Weaknesses, Opportunities, and Threats. Strengths and weaknesses are internal. Opportunities and threats come from outside.
To run one, start with evidence before the meeting: sales data, customer reviews, search trends, competitor pages. Fill each box with specific, checkable points. “Good brand” is useless. “Highest repeat purchase rate in our category” is a strength. Then pair the boxes using a TOWS matrix: which strengths capture which opportunities, and which weaknesses leave you exposed to which threats. The top three pairings become your strategic priorities.
Nykaa shows how it reads in practice. A reputation for selling authentic beauty products is a strength. Marketplaces like Amazon and Flipkart selling beauty is a threat. The pairing points toward leaning harder on authenticity, curation, and beauty content.
Watch out for the common failure: most SWOTs turn into long lists nobody acts on. Cap each box at five points and finish by choosing priorities.
PESTLE Analysis: What Is the Outside World Doing?
PESTLE analysis scans six external forces: Political, Economic, Social, Technological, Legal, and Environmental. Where SWOT looks at you, PESTLE looks at everything you can’t control.
Give each category a short list of factors, then rate each factor from 1 to 5 on impact and on likelihood. Keep the ones that score high on both and give each an owner who’ll watch it. Two examples show how this feeds a marketing strategy. On the legal side, India’s Digital Personal Data Protection Act, 2023 changes how brands collect and store customer consent, which affects email lists and retargeting. On the technological side, Gartner’s 2026 Marketing Symposium/Xpo sessions flagged that answer engines, chatbots, and AI agents now shape how products get described and compared, which affects how brands think about search visibility.
PESTLE is a snapshot, not a permanent answer. Refresh it every six months.
Porter’s Five Forces: How Attractive Is Your Market?
Porter’s Five Forces is a model that measures how intense competition is in an industry by rating five forces: rivalry among existing competitors, threat of new entrants, threat of substitutes, bargaining power of buyers, and bargaining power of suppliers. Michael Porter introduced it in Harvard Business Review in 1979.
Rate each force low, medium, or high, with one line of evidence each. The ratings tell you what kind of strategy can work. High rivalry and strong buyer power usually mean you can’t win on price alone and need a sharper brand, a niche, or lock-in.
Indian quick commerce is a clean example. Rivalry is high, with Blinkit, Swiggy Instamart, and Zepto all chasing the same urban households. Buyer power is high too, because switching apps takes seconds. That’s exactly why loyalty programs, exclusive assortments, and delivery-speed promises matter so much in the category.
Define the industry narrowly. “Retail” is too broad to be useful. “Ten-minute grocery delivery in metro India” is workable.
STP Model: Segmentation, Targeting, and Positioning
The STP model is a three-step process that moves a business from a broad market to a specific audience and a clear place in their minds.
Segmentation divides the market into groups with shared needs or behaviours, using demographics, geography, behaviour, or psychographics (attitudes and values). Targeting picks the segments worth pursuing, judged on size, growth, reachability, profitability, and fit with your strengths. Positioning defines how you want that segment to see you compared with alternatives.
Write the positioning as one sentence: “For [target customer], [brand] is the [category] that [main benefit] because [reason to believe].”
Mamaearth is a good case. It segmented the beauty market by parents who worry about what goes onto a baby’s skin, targeted that group first, and positioned the brand as toxin-free, backed by Made Safe certification as the reason to believe. The brand later widened to adult skin and hair care, but the trust built with that first segment carried over.
Ansoff Matrix: Which Growth Direction Should You Pick?
The Ansoff Matrix is a two-by-two grid that maps four growth options by crossing existing or new products with existing or new markets. Igor Ansoff published it in Harvard Business Review in 1957 under the title “Strategies for Diversification.”
List growth ideas under each quadrant, then score each on revenue potential, cost, risk, and fit with current strengths. Allocate budget by risk: the largest share to penetration, smaller test budgets to development, and a deliberately small, capped bet for diversification. The earlier growth strategies table shows one real brand example per quadrant.
The matrix tells you direction, not attractiveness. It won’t say whether the new market is worth entering, so pair it with Porter’s Five Forces before committing real money.
BCG Matrix: Where Should the Next Rupee Go?
The BCG Growth-Share Matrix is a portfolio tool that plots each product or brand by market growth rate (vertical axis) and relative market share (horizontal axis). Bruce Henderson created it at Boston Consulting Group in 1970.
Four boxes result. Stars have high growth and high share, so they deserve investment. Cash Cows have low growth and high share, so they fund everything else. Question Marks have high growth and low share, so they need testing before more money goes in. Dogs have low growth and low share, so they get fixed, merged, or retired.
To use it, list your product lines, estimate market growth and relative share from industry reports, plot them, and assign a budget stance to each. A multi-brand company such as Honasa Consumer, which owns Mamaearth, The Derma Co, and Aqualogica, faces this question every planning cycle: which brand earns the next unit of growth budget?
The limits are real. Results change with how you define the market, and the matrix ignores shared costs and brand synergies. If you have a single product, skip it.
7Ps Marketing Mix: How Do You Turn Strategy Into an Offer?
The 7Ps marketing mix is a checklist of seven levers a business controls to deliver its positioning. E. Jerome McCarthy popularised the original four Ps in 1960, and Booms and Bitner extended it to seven for service businesses in 1981.
- Product: what you sell, including features, quality, and packaging.
- Price: list price, discounts, payment terms, and what the price signals.
- Place: where and how customers can buy, online and offline.
- Promotion: how you communicate, through advertising, content, PR, and sales.
- People: everyone customers deal with, from support to store staff.
- Process: the steps that deliver the experience, such as checkout and fulfilment.
- Physical evidence: anything tangible that proves quality, from stores to packaging to website design.
Audit each P against your positioning statement. Any P that contradicts the position is a leak. Apple’s premium price, its Apple Store design (physical evidence), and its Genius Bar support staff (people) all say the same thing: this is a premium, well-supported experience.
Customer Journey Mapping: Where Do Customers Drop Off?
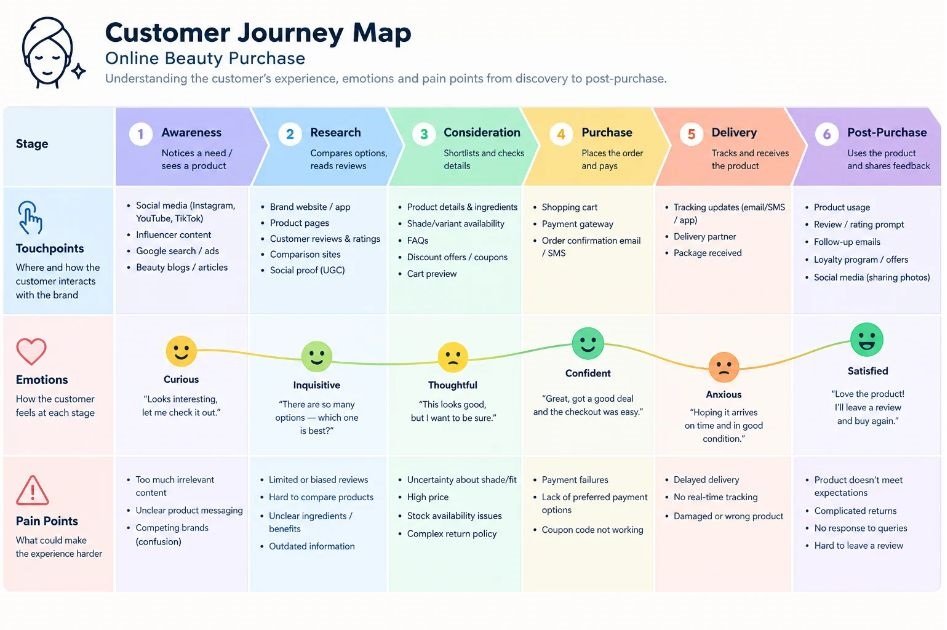
Customer journey mapping is the practice of charting every step a customer takes from first awareness to repeat purchase, including their actions, thoughts, emotions, and touchpoints.
- Pick one persona or segment. Mapping everyone produces mush.
- List the stages: awareness, consideration, purchase, onboarding, retention, and advocacy.
- Gather evidence from customer interviews, support tickets, and Google Analytics 4’s funnel and path explorations.
- Mark pain points and drop-offs on the map.
- Assign an owner to fix the top three.
Here’s a typical illustration. A GA4 funnel exploration shows a steep drop between add-to-cart and payment. The journey map, built from support tickets, reveals that delivery charges only appear at the last step. The fix is a pricing display change, not a bigger ad budget.
OKRs: What Will You Chase This Quarter?
OKRs, short for Objectives and Key Results, are a goal-setting method where one qualitative objective is paired with three to five measurable key results. Intel’s Andy Grove developed the approach, and venture investor John Doerr introduced it to Google and later wrote Measure What Matters (2018).
The objective should be inspiring and time-bound. Key results must be numbers you can check. Here’s an illustrative example, with placeholder numbers: Objective: become the first brand new parents trust in tier-2 cities. Key result 1: lift repeat purchase rate in those cities from 18% to 25% by the end of the quarter. Key result 2: add 40 pediatrician partnerships. Key result 3: cut customer acquisition cost in those cities by 15%.
OKRs aren’t a to-do list. If a key result reads like a task (“launch a campaign”), rewrite it as an outcome (“reach 5,000 new customers”).
Balanced Scorecard: Is the Whole Business Healthy?
The Balanced Scorecard is a performance framework that tracks results across four perspectives: financial, customer, internal processes, and learning and growth. Robert Kaplan and David Norton introduced it in Harvard Business Review in 1992.
Translate each perspective into marketing metrics. Financial: revenue and customer acquisition cost payback. Customer: retention rate and Net Promoter Score (NPS, a survey measure of how likely customers are to recommend you). Internal processes: campaign launch time and lead response speed. Learning and growth: team skills and the number of experiments run each quarter.
How does it differ from OKRs? The scorecard gives a stable, balanced view of health year after year. OKRs push specific stretch goals every quarter. Many teams use the scorecard for annual health and OKRs for quarterly focus.
Research and Analytics Software: What Does the Data Say?
Frameworks are only as good as the evidence you put into them. These five tools supply it.
- Google Analytics 4 (GA4): Google’s free, event-based analytics platform. Its Explorations (funnel and path reports) and attribution reports show how customers move through your journey and which channels get credit. Use it for journey mapping and for measuring results.
- Google Trends: a free tool that compares search interest over time and by region. It helps validate demand, spot seasonality, and feed the PESTLE social and economic categories.
- Semrush: a paid platform for competitor research. Its traffic analytics, keyword gap, and position tracking features show where rivals get traffic and which search terms they own. Use it during the market and competitor audit.
- SparkToro: an audience research tool that shows which websites, podcasts, social accounts, and keywords your target audience engages with. It’s useful for segmentation and for choosing channels.
- HubSpot: a CRM and marketing platform that tracks lead sources, lifecycle stages, and revenue per channel. It connects marketing activity to sales outcomes, which makes reporting on a strategy possible.
Tool choice matters less than discipline. Pick the minimum set that answers your questions and review it on a schedule.
The core tools of marketing strategy are SWOT, PESTLE, Porter’s Five Forces, the STP model, the Ansoff Matrix, the BCG Matrix, the 7Ps, customer journey mapping, OKRs, and the Balanced Scorecard. Audit tools find the facts, choice tools pick the direction, and execution and management tools turn it into measurable work.
How Do You Approach Strategic Marketing Planning Step by Step?
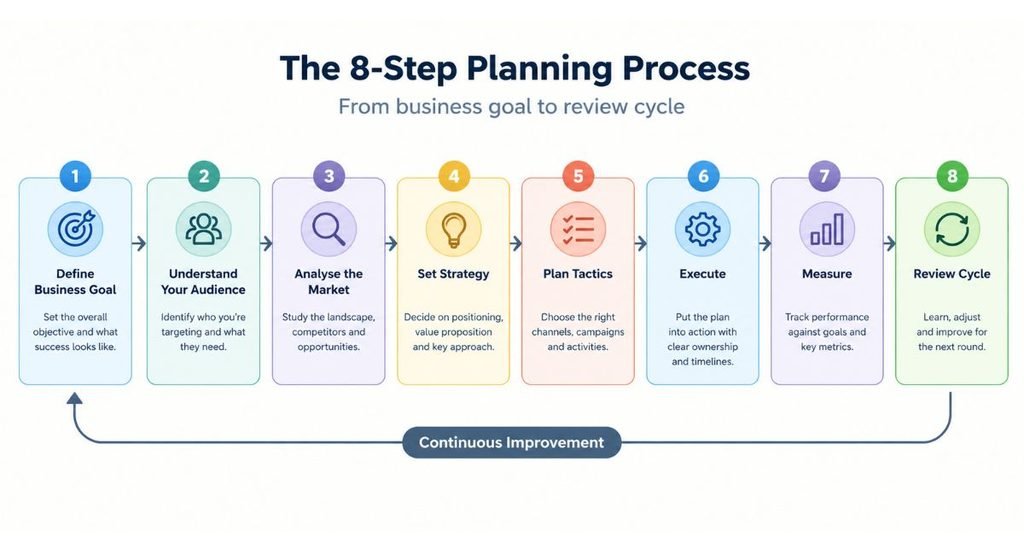
Strategic marketing planning is a repeatable process that moves from business goals to research, positioning, strategic choices, budget, and measurement. Most teams run it once a year and revisit it every quarter.
- Step 1: Set the business goal. Get the number from finance or leadership, such as growing revenue 40% or entering a new city, then define marketing’s share of it.
- Step 2: Audit the market. Run SWOT, PESTLE, and Porter’s Five Forces, and pull data from GA4, Semrush, and Google Trends. Choose the strategic marketing frameworks that answer your actual questions instead of running all of them out of habit.
- Step 3: Define segments and positioning. Use the STP model and write the one-sentence positioning statement.
- Step 4: Choose the growth direction. Use the Ansoff Matrix for direction and the BCG Matrix if you run several products or brands.
- Step 5: Design the offer and the journey. Audit the 7Ps against your positioning, then map the customer journey and fix the biggest drop-offs.
- Step 6: Allocate budget and channels. Fund each journey stage by its role. A common rule of thumb is to hold back 10 to 20% for testing new ideas.
- Step 7: Set OKRs and a scorecard. Define three to five outcome-based key results and the health metrics you’ll watch.
- Step 8: Review on a fixed schedule. Check metrics monthly, hold a strategy review every quarter, and reset the plan annually.
Where does AI fit? At the 2026 Gartner Marketing Symposium/Xpo, Gartner analyst Amy Abatangle argued that most marketing teams still use AI for productivity, such as saving time and cutting costs, while the larger opportunity is using it for strategic decision support. Practically, that means feeding AI your audit data and asking it to challenge your assumptions, not just to write the plan. It can speed up strategic marketing planning, but it can’t decide what you’re willing to give up.
Which Brands Have Run a Strong Marketing Strategy?
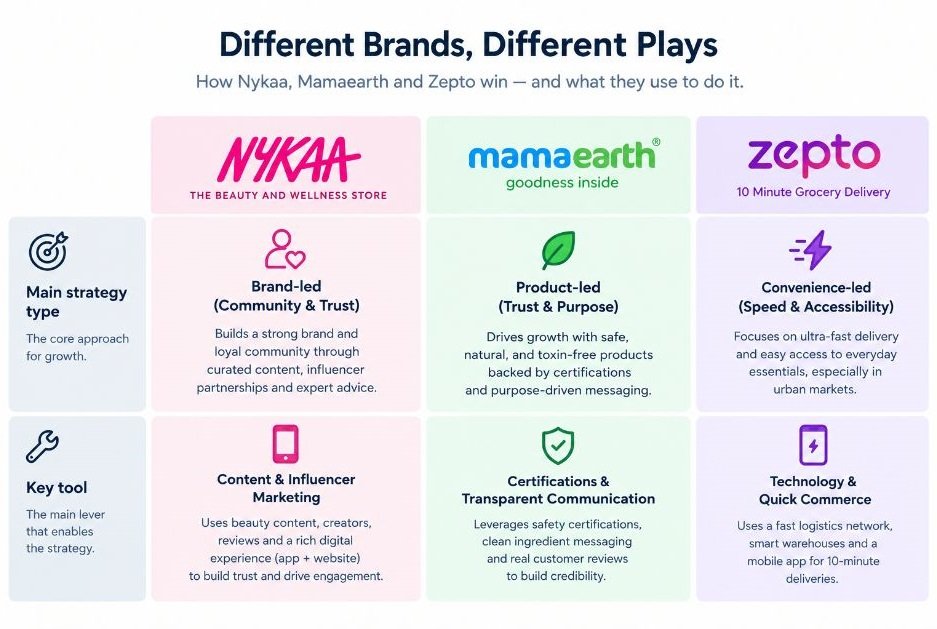
Three Indian brands show different strategic choices clearly. Notice how each ties to the tools above.
Nykaa: Trust First, Then Category Expansion
Falguni Nayar founded Nykaa in 2012 as an online beauty retailer at a time when counterfeit products worried buyers. Authenticity became the positioning. From that base, Nykaa expanded: it opened physical stores, built private-label brands, launched Nykaa Fashion in 2018, and listed on the stock exchanges in 2021.
The pattern is clean. Win trust in a core segment, then use product development and channel expansion (Ansoff) to grow around it. The takeaway: earn the right to expand before you do.
Mamaearth: One Sharp Segment, Then a Portfolio
Varun and Ghazal Alagh started Mamaearth in 2016 with baby care and a clear promise of toxin-free products. Made Safe certification gave the claim a reason to believe. The brand then expanded into skin and hair care, and its parent company Honasa Consumer went public in 2023 with a multi-brand portfolio.
This is STP followed by portfolio management. The takeaway: a narrow starting segment isn’t a limit. It’s a launchpad.
Zepto: A Single Promise Backed by Operations
Zepto’s strategy is focus plus differentiation. It picked one customer promise, groceries in about ten minutes, and built its operations around it. Dark stores, picking processes, and delivery routing all serve the promise, which is the Process leg of the 7Ps doing real work.
The takeaway: positioning only holds when operations back it up. A promise your fulfilment can’t keep is just advertising.
How Does Strategic Marketing for Startups Differ From Big-Company Planning?
Strategic marketing for startups focuses on finding one segment that urgently needs your product, proving it through a narrow channel, and only then widening. It trades breadth and polish for speed of learning.
The reason is simple. CB Insights’ analysis of 101 startup post-mortems ranked “no market need” as the top cause of failure at 42%, ahead of running out of cash at 29%. Poor marketing showed up in 14%. Startups rarely die from too little advertising. They die from building something the market doesn’t want badly enough.
Here’s the startup version of the process:
- Validate the problem. Talk to at least 15 to 20 target customers before spending on ads.
- Pick a beachhead segment, meaning a small, specific group you can win first. Think “parents of newborns in Pune,” not “all parents.”
- Write a one-sentence positioning statement and test it on a landing page.
- Choose one channel and push it until returns flatten before adding another.
- Set 90-day OKRs built on customer acquisition cost, payback period, and conversion.
- Review monthly. Startups can’t afford quarterly feedback loops.
Use lightweight versions of the tools. STP, a one-page SWOT, and the penetration quadrant of the Ansoff Matrix are enough early on. Skip the BCG Matrix until you have several products.
One caution on benchmarks. The Gartner 7.8% of revenue figure comes from a sample dominated by companies with over $1 billion in revenue, so don’t copy it. Early-stage budgets are driven by runway and payback, not by a percentage of revenue. This playbook also fits product-led and D2C businesses best. Enterprise B2B with long sales cycles needs account-based mapping on top.
What Mistakes Derail a Marketing Strategy?
Most strategic marketing strategies fail in execution, not in design. These are the six mistakes that show up most often.
- Confusing a channel list with a strategy. If your plan says “Instagram, SEO, email” and nothing about audience or position, it’s a tactics list.
- Starting with the template instead of the question. Filling in a SWOT because the template exists produces opinions dressed up as analysis. Start with what you need to decide.
- Targeting everyone. “Women aged 18 to 45” isn’t a segment. It’s a census category.
- No owner and no review date. Plans without names and dates die in a shared folder.
- Measuring activity instead of outcomes. Impressions and follower counts feel good. Revenue, retention, and payback pay the bills.
- Treating the plan as fixed. Markets shift, platforms change, and AI search is changing discovery. A strategy that’s never revised is a liability.
How Do You Measure Whether the Strategy Is Working?
Measure a strategy with a small set of outcome metrics tied to each business goal: customer acquisition cost, lifetime value, retention rate, marketing efficiency ratio, and brand demand. Review them monthly and judge the strategy quarterly.
| Metric | What it tells you | How it’s calculated |
|---|---|---|
| Customer acquisition cost (CAC) | What it costs to win a customer | Total sales and marketing spend divided by new customers |
| Customer lifetime value (LTV) | What a customer is worth over time | Average order value x purchase frequency x customer lifespan x gross margin |
| LTV to CAC ratio | Whether growth is profitable | LTV divided by CAC |
| Marketing efficiency ratio (MER) | Total revenue per marketing dollar across all channels | Total revenue divided by total marketing spend |
| Retention rate | Whether customers come back | Returning customers divided by total customers in a period |
| Branded search volume | Whether brand demand is growing | Tracked in Google Search Console or Google Trends |
| Net Promoter Score | How likely customers are to recommend you | Survey: percent promoters minus percent detractors |
Separate leading from lagging indicators. Revenue and retention lag by weeks or months. Leading indicators, such as conversion rate, branded search growth, and sales-qualified leads, move first and tell you early whether the strategy is on track.
When results disappoint, work backwards. Check whether the audience definition is right, then the positioning, then the offer, and only then the campaigns. Most teams do the reverse and burn budget fixing creative that was never the problem.
Conclusion
Three ideas are worth carrying out of this article. A strategy is the set of choices about audience, position, and spend, not a list of channels. The tools (SWOT, STP, Ansoff, OKRs, and the rest) are only there to make those choices evidence-based. And a strategy isn’t finished when it’s written. It’s finished when it has owners, metrics, and a review date.
If you’re starting from zero, do this week’s work in three moves. Write your positioning statement in one sentence. Pick one segment and one growth direction. Set three outcome metrics and put the first review on the calendar. That’s enough to move from running campaigns to running a strategy.
Frequently Asked Questions
What is strategic marketing in simple words?
Strategic marketing is the long-term thinking behind your marketing: who you serve, why they should pick you, and where you’ll put your money to reach business goals. It sits above individual campaigns. If a campaign is a move, strategic marketing is the game plan.
What’s the difference between a marketing strategy and a marketing plan?
A marketing strategy sets the direction: audience, positioning, and goals. A marketing plan lists the actions, budgets, owners, and timelines that carry it out. The strategy changes slowly, while the plan is updated every quarter or campaign cycle.
What are the main types of marketing strategies?
There are three broad groups. Growth strategies include market penetration, market development, product development, and diversification. Competitive strategies include cost leadership, differentiation, and focus. Customer-focused strategies include acquisition, retention, and brand-building.
How do I create a strategic marketing plan from scratch?
Start with the business goal, then audit your market with SWOT, PESTLE, and Porter’s Five Forces. Define your segment and positioning with the STP model, choose a growth direction with the Ansoff Matrix, and design the offer using the 7Ps. Finish with OKRs, a budget, and a fixed review schedule.
Which marketing framework should I start with?
For most teams, start with SWOT and STP. SWOT shows where you stand and STP forces you to pick an audience and a position. Add PESTLE and Five Forces when you’re entering a new market or facing heavy competition.
Do small businesses and startups really need a marketing strategy?
Yes, but a lightweight one. Strategic marketing for startups doesn’t need a 40-page deck. A one-page document covering your target segment, positioning statement, one main channel, and three metrics is often enough to stop you wasting scarce budget.
How long should a marketing strategy last?
Most strategies are set for one year with a quarterly review. The core choices, such as audience and positioning, often hold for two to three years, while channels, budgets, and tactics get updated much faster.
Why isn’t my marketing strategy working?
Usually the problem sits upstream of the campaigns. Check, in order, whether your audience is too broad, whether your positioning is distinct from competitors, whether the offer matches what customers want, and whether you’re measuring outcomes instead of activity. Fixing creative before fixing those is the most common waste of budget.
How much should I spend on marketing?
Benchmarks vary widely. Gartner’s 2026 CMO Spend Survey found marketing budgets averaging 7.8% of company revenue, but its sample leans heavily toward companies with over $1 billion in revenue. Smaller and faster-growing companies often spend more, so base your number on payback period and runway instead of copying a percentage.
Can AI help me build a marketing strategy?
Yes, as a thinking partner. It’s useful for summarising research, challenging assumptions, and drafting options, but it can’t choose your audience or decide what to give up. Gartner’s 2026 research found that 70% of CMOs want to become AI leaders, yet only 30% feel ready to scale it, so start small and keep a human making the strategic calls.


