

Add a product and you add a cost. Shelf space, ad budget, inventory and team attention all get stretched a little thinner. Skip new products and your competitors fill the gap. Every brand, from Hindustan Unilever to a ten-SKU D2C startup, lives inside that tension.
Before you can manage it, you need a clear answer to one question: what is product mix, and how do you measure it? A product mix is the full range of products a company sells, organised into product lines. Get it right and a sound product mix strategy lifts revenue while keeping costs in check. Get it wrong and you end up with a bloated catalogue where half the items lose money.
This article covers the definition, the four dimensions, the main ways to change your range, real examples, six tools for analysing it, and a step-by-step process for improving yours.
Product Mix Definition: What Counts as Your Full Range?
A product mix, also called a product assortment or product portfolio, is the total set of products and services a company offers for sale. It’s organised into product lines and described by four measurable dimensions: width, length, depth, and consistency. Philip Kotler’s textbook Marketing Management popularised this framework.
Three terms get mixed up constantly, so here’s the clean split:
- A product item is one specific version you sell, such as Maggi 2-Minute Masala Noodles in a 70g pack.
- A product line is a group of closely related items, such as all of Nestle India’s Maggi noodles.
- A product mix is every line combined: noodles, coffee, chocolates, infant nutrition, and the rest.
Don’t confuse the product mix with the marketing mix. The marketing mix is the 4Ps framework (product, price, place, promotion) coined by E. Jerome McCarthy in 1960. Your product mix is the detailed breakdown of just the first P.
Why bother measuring any of this? Because you can’t prune, expand, or price a range you haven’t mapped.
The Four Dimensions of Product Mix: Width, Length, Depth, and Consistency
Width is how many product lines you have, length is how many items you sell in total, depth is how many versions of each item exist, and consistency is how closely your lines relate. Together they let you describe any company’s range in four numbers and compare it with competitors.
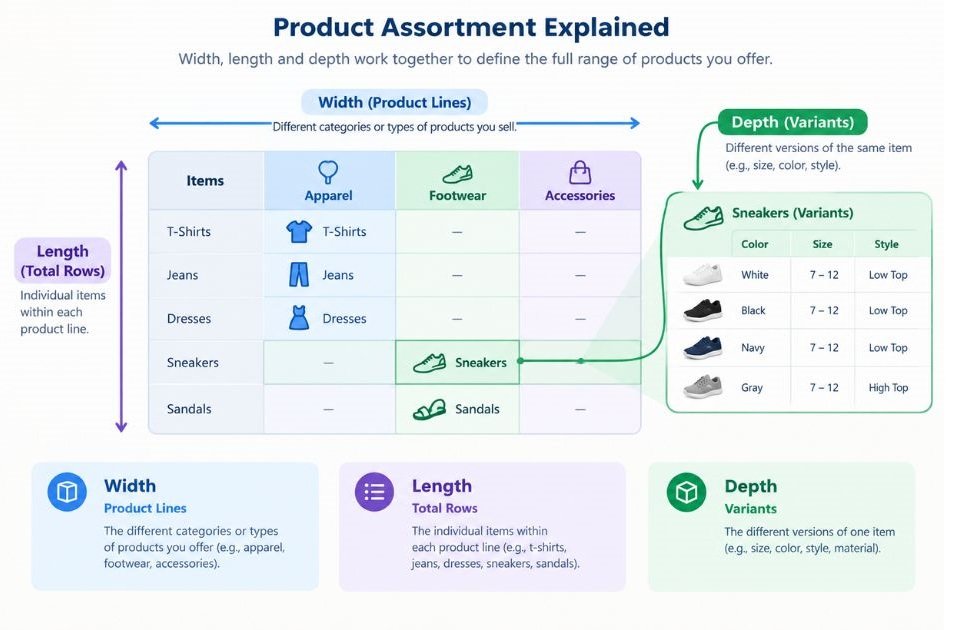
Width
Width counts your product lines. A company with one line, say only running shoes, has a narrow mix. A company selling shoes, apparel, equipment, and accessories has a wide one.
Honasa Consumer, the parent of Mamaearth, started in baby care and then widened into skincare, haircare, and colour cosmetics. Wider mixes reach more customers, but they also spread your marketing budget across more fronts.
Length
Length is the total number of items across all your lines. Divide it by the number of lines and you get average line length.
Length tells you how much choice you’re offering inside each line. Too short and you lose shoppers who want a different size or price. Too long and items start cannibalising each other.
Depth
Depth counts the variants of each individual product: sizes, flavours, formulations, or packaging. Maggi Masala noodles sold in several pack sizes, plus Atta and Cuppa variants of the brand, show depth at work.
Deep mixes win customers who want specific options. They also multiply your inventory headaches, because every extra variant is another SKU to forecast.
Consistency
Consistency measures how closely related your lines are in use, production, distribution, or target customer. Apple’s mix is highly consistent: nearly everything is consumer electronics sold through the same channels to overlapping buyers. The Tata Group is the opposite, with salt, tea, watches, cars, and hotels under one name.
One caveat on the Tata example: those are separate companies in a group portfolio, so it’s not a single firm’s product mix in the strict sense. It still shows low consistency clearly.
Here’s a simplified Nestle India sample to show the arithmetic. It’s illustrative, not the full catalogue.
| Product line | Sample items | Items in sample |
|---|---|---|
| Noodles | Maggi Masala, Maggi Atta | 2 |
| Beverages | Nescafe Classic, Nescafe Sunrise | 2 |
| Confectionery | KitKat, Munch | 2 |
| Infant nutrition | Cerelac, Lactogen | 2 |
In this sample, width is 4 lines, length is 8 items, and average line length is 2 items.
A product mix is measured on four dimensions. Width is the number of product lines, length is the total number of items, depth is the number of variants per item, and consistency is how closely the lines relate. Widening a mix reaches more customers, while deepening it serves existing customers better.
Types of Product Mix Strategies: Expand, Prune, Alter, or Standardise
You can change a product mix in four basic ways: expand it by adding lines, items, or variants; contract it by cutting weak ones; alter it by moving items up or down in price; or standardise or customise it across markets. Most companies run several at once.
Expansion
Expansion comes in three flavours. Widening adds new product lines, lengthening adds items to an existing line, and deepening adds variants of existing items.
boAt is a clean example. It began with earphones and cables, then added speakers, headphones, and smartwatches. Each step broadened what an existing customer could buy from the same brand.
Contraction
Contraction removes weak performers so resources go to the winners. It’s the hardest move emotionally, because nobody enjoys killing a product someone spent two years building.
Apple shows how far it can go. According to Walter Isaacson’s 2011 biography of Steve Jobs, Apple cut its range from around 350 products to about 10 after Jobs returned in 1997. The simpler mix is widely credited with helping the company recover.
Alteration: Trading Up and Trading Down
Trading up means adding a premium item to lift your brand’s image and margin. Trading down means adding a lower-priced item to reach buyers you’re currently missing.
Apple does both: the iPhone Pro models sit at the premium end, while the iPhone SE has historically been the entry-priced option. Done badly, though, trading down can dilute a premium brand.
Standardisation vs Customisation
Standardising means selling the same mix everywhere. Customising means adapting it to local tastes, laws, or income levels.
McDonald’s India is the classic case. It doesn’t sell beef, and it built items like the McAloo Tikki for local vegetarian demand. Standardisation saves money, while customisation wins share, so the right answer depends on how different your markets really are.
Real Product Mix Examples From Indian and Global Brands
The best way to see these dimensions at work is to look at companies with very different mixes. Five of them follow, each showing a different trade-off between width, depth, and consistency.
Hindustan Unilever (HUL)
HUL runs a wide mix across home care, beauty and personal care, and foods and refreshment. Brands include Surf Excel, Vim, Dove, Lakme, Lifebuoy, Pond’s, Brooke Bond, and Horlicks.
Consistency is moderate: everything is fast-moving consumer goods sold through the same retail and distribution network. That shared channel is what makes such a wide mix workable.
Nestle India
Nestle India’s mix is narrower than HUL’s but deep in its core lines. Maggi, Nescafe, KitKat, Munch, and Cerelac each carry several variants.
Its strategy leans on depth. It keeps customers inside a brand by offering a variant for every occasion and price point.
Tata Group
Tata’s mix is wide and low in consistency, covering Tata Salt, Tata Tea, Titan watches, Tata Motors vehicles, and Taj hotels. The shared parent brand carries trust across unrelated categories.
The limitation is that a failure in one category can bruise the umbrella brand’s reputation. That risk grows as consistency falls.
Apple
Apple’s mix is narrow but highly consistent. As of 2026 the hardware lineup spans iPhone, iPad, Mac, Apple Watch, AirPods, and Apple Vision Pro, plus services like iCloud and Apple Music.
Narrow width lets Apple spend heavily on each line. Its high consistency means a customer who buys one product is easy to sell the next.
Procter & Gamble (P&G)
P&G runs one of the world’s widest consumer mixes, from Tide and Ariel to Gillette, Pampers, and Oral-B. In 2014, then-CEO A.G. Lafley announced the company would sell or discontinue roughly 100 brands to focus on about 65 core ones.
That’s contraction at scale. A wide mix only pays off if every line earns its place.
Six Tools to Analyse and Manage Your Product Mix
Spotting that your mix needs work is easy. Knowing what to change is harder, and that’s where analysis tools come in. A written product mix strategy is only as good as the data and frameworks behind it, so here are six tools, each with how it works and where it falls short.
1. Product Mix Audit and Width/Length/Depth Table
An audit is a structured inventory of everything you sell, and it’s the foundation for every other tool here. You build it in a spreadsheet.
- List every item you sell, one per row.
- Add columns for product line, price, units sold, revenue, variable cost, and launch date.
- Count lines for width, items for length, and variants per item for depth.
- Add a column marking which items share customers, suppliers, or channels, to gauge consistency.
The strength is clarity, because most teams discover items they’d forgotten existed. The limit is that an audit describes the mix without telling you what to do about it.
2. BCG Growth-Share Matrix
The BCG matrix sorts your products by market growth rate and relative market share. Bruce Henderson of Boston Consulting Group introduced it in 1970.
It creates four categories: Stars (high growth, high share), Cash Cows (low growth, high share), Question Marks (high growth, low share), and Dogs (low growth, low share). The standard advice is to invest in Stars, milk Cash Cows, test Question Marks carefully, and consider exiting Dogs.
You could argue the iPhone is Apple’s Cash Cow, while a newer line like Vision Pro looks more like a Question Marks bet. That’s a judgement call, not company-confirmed data. The matrix’s weakness is that small brands rarely have reliable market-share figures, and it ignores how products support each other.
3. Ansoff Matrix
The Ansoff Matrix shows four growth routes based on whether you sell existing or new products to existing or new markets. Igor Ansoff published it in Harvard Business Review in 1957.
The four routes are market penetration (existing product, existing market), market development (existing product, new market), product development (new product, existing market), and diversification (new product, new market). Risk climbs as you move toward diversification.
boAt launching smartwatches for its existing audience is product development. Use the matrix when you’re deciding which type of expansion to chase first. Its limit is that it says nothing about profitability, only direction.
4. Product Life Cycle Analysis
The product life cycle tracks a product through four stages: introduction, growth, maturity, and decline. Theodore Levitt popularised the idea in Harvard Business Review in 1965.
You plot each item’s sales over time and see which stage it’s in. Introduction items need awareness spend, growth items need capacity, maturity items need cost control, and decline items need an exit plan.
Apple’s iPod is a tidy example. The line peaked in the 2000s, and Apple discontinued the last iPod model, the iPod Touch, in May 2022. The weakness of the model is that it can’t tell you whether a dip is a real decline or a temporary slump.
5. Contribution Margin and ABC Analysis
Contribution margin is selling price minus variable cost per unit, and it shows which items actually earn money. ABC analysis then ranks items by revenue contribution, building on Vilfredo Pareto’s 80/20 principle.
Take illustrative numbers: an item sells at ₹500 with ₹350 in variable cost. Its contribution margin is ₹150, or 30%. Do this for every item, then rank by total revenue.
“A” items are the small group driving most revenue, “B” items sit in the middle, and “C” items are the long tail. Thresholds vary by business, so many teams use roughly 70%, 20%, and 10% as a starting point. Check C items for pruning, but remember some exist to support A items.
6. Customer Segmentation and Demand Data
Segmentation shows who buys what, and demand data shows what customers want that you don’t sell. Together they tell you where gaps in your mix are.
In Google Analytics 4, review the e-commerce purchase reports to see which items sell together. In your CRM or Shopify analytics, group customers by purchase history, using recency, frequency, and spend (RFM). Then check on-site search terms that return no results, because those are unmet demand.
Nykaa shows how a retailer can widen its mix beyond reselling, with own labels like Kay Beauty and Nykaa Cosmetics sitting alongside third-party brands. The catch is that data shows what customers do today, not what they’d buy from a genuinely new category.
Why Does Product Mix Matter for Revenue, Risk, and Brand?
A well-managed product mix grows revenue by reaching more customers, lowers risk by spreading sales across lines, and sharpens brand positioning by deciding what you stand for. It also controls cost, since every extra item needs inventory, marketing, and support.
Think of it as five levers:
- Revenue: More lines and variants mean more ways to sell to the same customer.
- Risk: If one line stalls, others cushion the drop.
- Positioning: The range you sell tells customers what your brand is for.
- Efficiency: Pruning weak items frees cash and attention for strong ones.
- Pricing power: A mix with premium and entry options captures buyers at different budgets.
None of this is automatic. Variety only helps if each item earns its place, which is why the audit comes first.
A product mix controls revenue, risk, brand positioning, and cost at the same time. Wider mixes spread risk and reach more customers, but each added item raises inventory and marketing costs. The goal is not the biggest range, it’s the range where every item earns its place.
How to Optimise Your Product Mix, Step by Step
You optimise a product mix by auditing what you sell, scoring each item on profit and growth, then expanding, pruning, or repricing based on the evidence. Write a short product mix strategy before you start, so every decision traces back to a goal like margin, growth, or market entry.
- Set one goal. Pick a priority: higher margin, faster growth, or new customers.
- Run the audit. Build the spreadsheet from tool one and count width, length, depth, and consistency.
- Score every item. Add contribution margin and ABC rank from tool five.
- Plot your lines. Place each line on the BCG matrix and note its life cycle stage.
- Find the gaps. Use customer data and the Ansoff Matrix to spot where a new item or market makes sense.
- Choose your moves. Decide per line: expand, prune, alter, or hold.
- Test small and review. Pilot new items before a full launch, and re-audit every quarter.
A caveat: this works best for businesses with enough sales history to score items. A brand with three months of data should lean more on customer interviews than on ABC rankings.
Common Product Mix Mistakes
Most mix problems come from the same handful of errors. Here are the ones we see most often:
- Adding items without removing any. The catalogue grows every year and nobody owns the cull.
- Judging items on revenue alone. A high-revenue item with thin margins can lose money once marketing is counted.
- Ignoring cannibalisation. A new variant can steal sales from a stronger sibling instead of adding new ones.
- Widening too far from the core. Low consistency stretches brand trust and operations at once.
- Never re-auditing. A mix that was right two years ago may be wrong today.
Conclusion
If you arrived wondering “what is product mix”, you now have the working answer: your full range, measured by width, length, depth, and consistency. The useful part isn’t the definition, it’s what you do with the measurements.
Three things matter most. First, map what you sell before changing it. Second, judge items on contribution margin, not revenue alone. Third, review the mix every quarter, because ranges drift faster than anyone expects.
Your next step is concrete: open a spreadsheet today and list every item you sell with its price, units, and variable cost. An hour of work will show you which lines to grow and which to cut.
FAQs
How would you define a product mix in one line?
A product mix is the complete set of products and product lines a company sells. It’s described by four dimensions: width, length, depth, and consistency. Marketers use it to compare ranges and plan additions or cuts.
Product mix vs product line: what’s the difference?
A product line is one group of related items, like all of a brand’s noodles. A product mix is every line a company sells combined. So the line is a part, and the mix is the whole.
How do you calculate the width, length, and depth of a product mix?
Count the number of product lines for width. Count the total items across all lines for length. For depth, count the variants of each item, such as sizes or flavours. A simple spreadsheet audit handles all three in under an hour for most small catalogues.
What’s the difference between product mix and marketing mix?
The marketing mix is the 4Ps framework: product, price, place, and promotion. The product mix is a detailed view of only the first P, meaning your full range. You use the product mix to decide what to sell, and the marketing mix to decide how to sell it.
Does a startup really need to think about product mix?
Yes, though in a simpler way. A startup with one or two products still decides how many variants to offer and whether to add a second line. Getting depth right early prevents costly inventory you can’t sell.
Is a wider product mix always better?
No. Wider mixes reach more customers, but they also raise costs and can dilute your brand. P&G cut around 100 brands in 2014 because some lines weren’t earning their keep. Widen only when new lines fit your brand and your channels.
How often should I review my product mix?
Re-audit at least every quarter if you sell consumer products, and monthly if you run fast-moving e-commerce. Look at sales, margin, and returns by item. Slower B2B businesses can often review twice a year.
Why isn’t my new product line selling? Is my mix the problem?
Sometimes. Check whether the new line cannibalises an existing one, whether it’s too far from your core customer, and whether your channels fit it. Low consistency is a common culprit. If the line is simply new, give it a fair test period before judging it.
What does consistency mean in a product mix?
Consistency is how closely your product lines relate in use, production, distribution, or target customer. High consistency, like Apple’s electronics, makes cross-selling easy. Low consistency, like the Tata Group’s mix of salt and cars, gives you diversification but demands more brand trust.
Which tool should I start with if I’ve never analysed my product mix?
Start with the audit spreadsheet. It’s free, fast, and every other tool depends on its data. Add contribution margin next, because knowing which items actually make money changes most decisions.


What Is Pragmatic Marketing? A Beginner’s Guide With Examples
October 27, 2026 - 12:00 pm[…] pragmatic approach is a market-driven method for building and marketing products. You decide what to build based on validated customer problems, not internal opinions. Then you […]